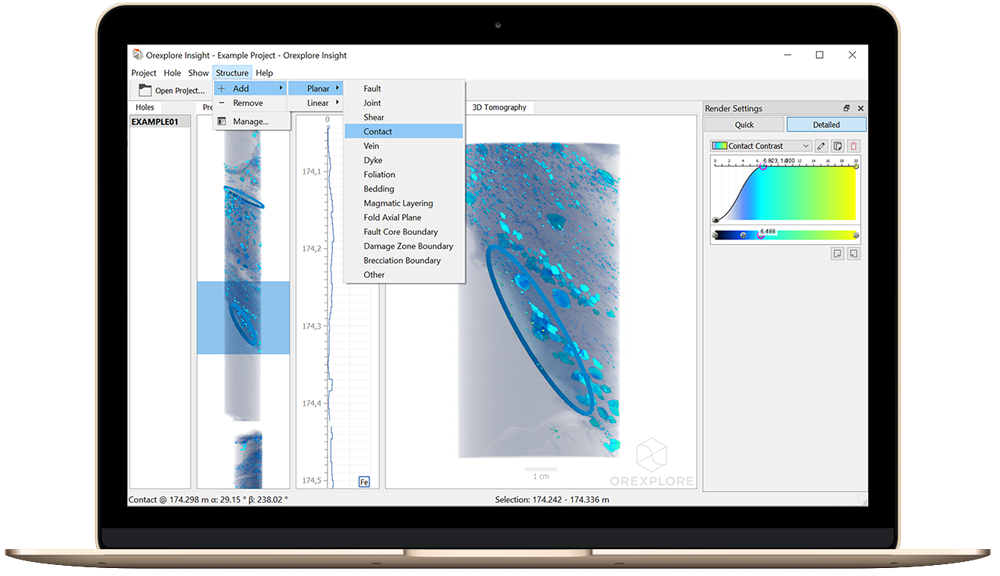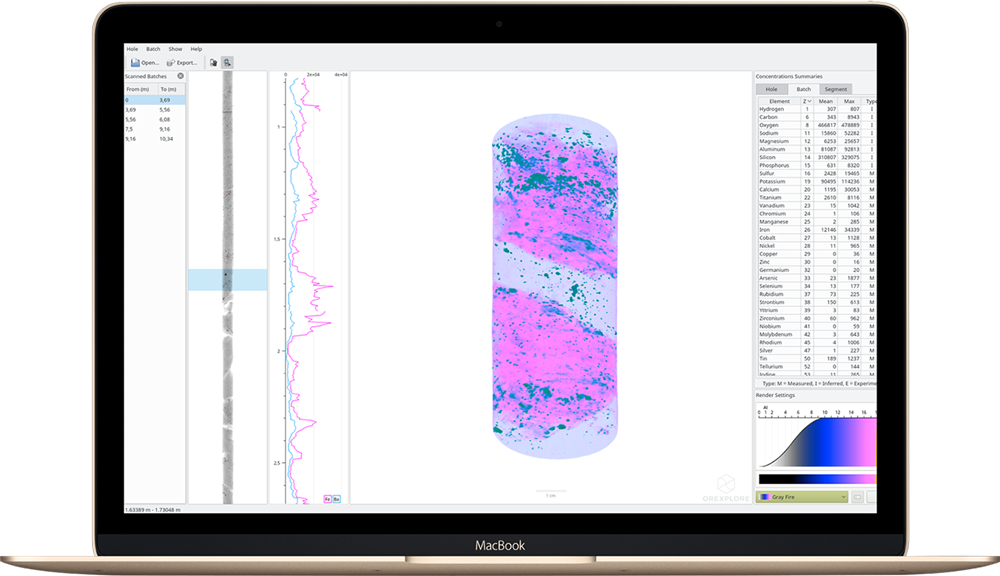
List of drill holes,
providing an overview of
scanned core.
providing an overview of
scanned core.
Tomographic preview of the
current drill hole,
with support for
panning and zooming.
current drill hole,
with support for
panning and zooming.
Down-hole elements plot showing detected chemical elements for each section of core.
High resolution 3D
tomography view showing
the currently
selected segment.
tomography view showing
the currently
selected segment.
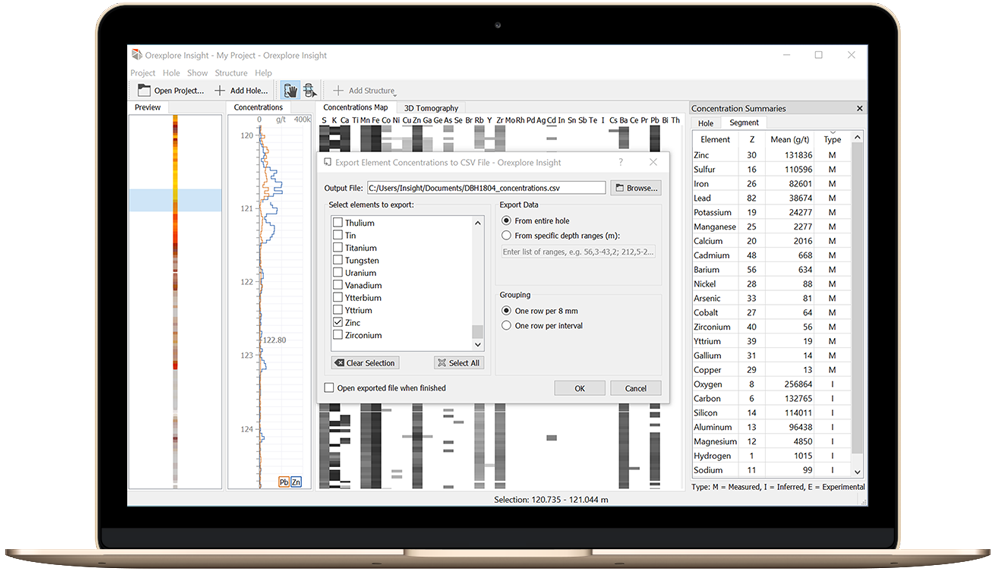
Concentration summary tables
showing the mean element concentration
for the selected segment.
showing the mean element concentration
for the selected segment.
Advanced render settings
for customising the
3D tomography rendering.
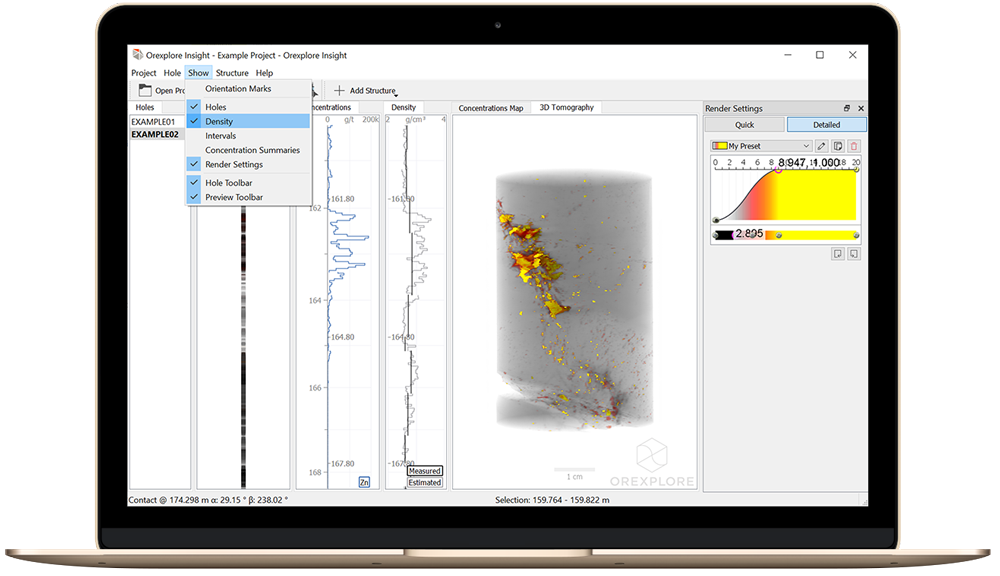
List of drill holes,
providing an overview
of scanned core.
providing an overview
of scanned core.
Tomographic preview of
the current drill hole,
with support for panning
and zooming.
the current drill hole,
with support for panning
and zooming.
Down-hole concentration
plot showing chemical
elements concentrations
in grams per tonne.
plot showing chemical
elements concentrations
in grams per tonne.
High resolution 3D
tomography view showing
the currently selected segment.
tomography view showing
the currently selected segment.
Concentration summary tables
showing the mean element concentration
for the selected segment.
showing the mean element concentration
for the selected segment.
Advanced render settings
for customizing the
3D tomography rendering.
for customizing the
3D tomography rendering.